12.02.2025
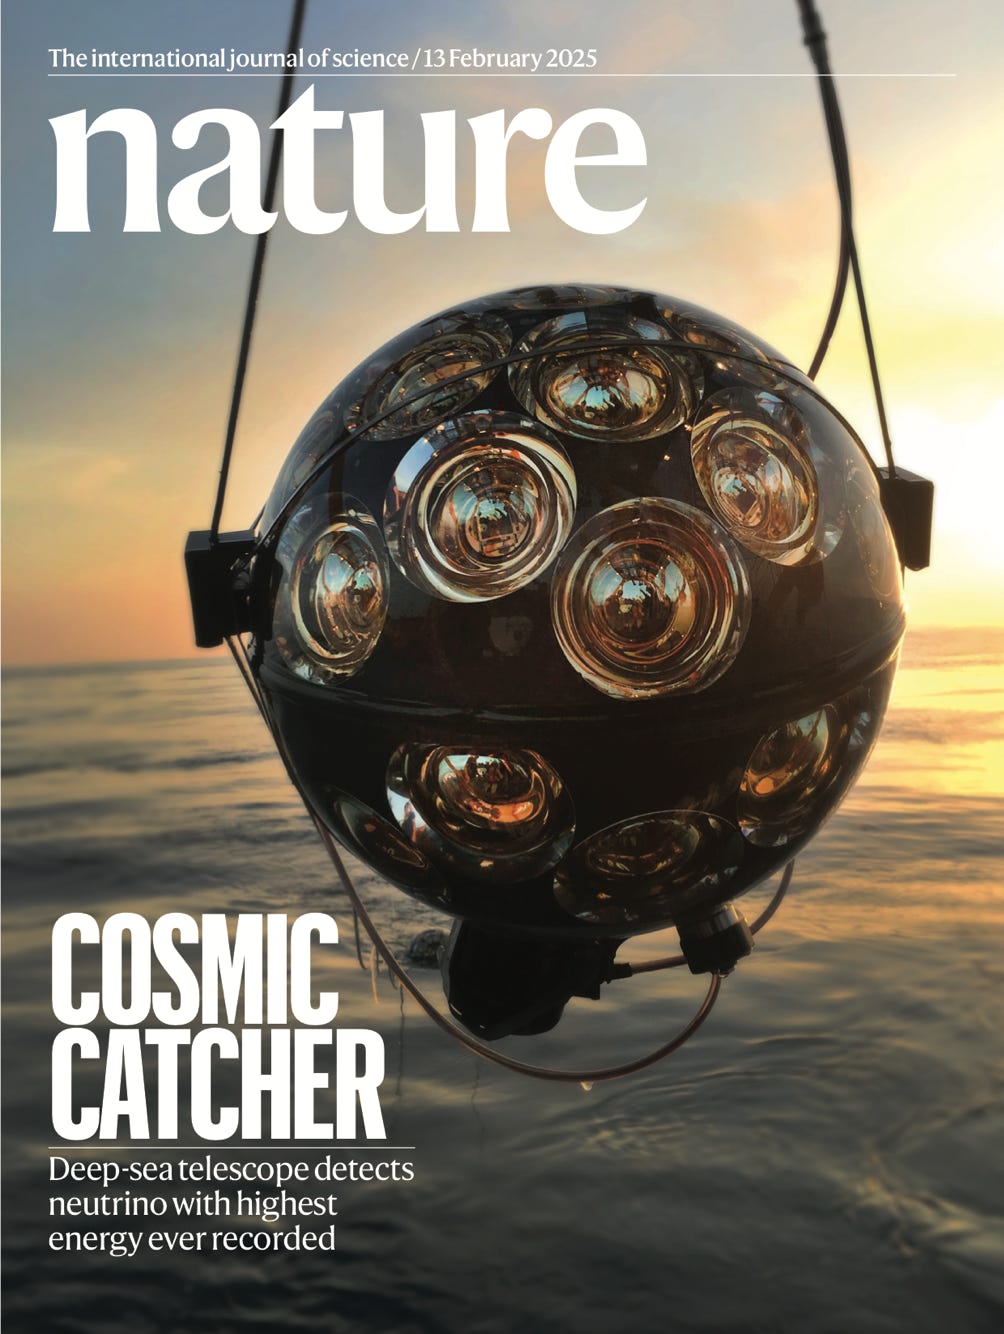
From the abyss of the Mediterranean Sea, the KM3NeT Collaboration announces the detection of a cosmic neutrino with a record-breaking energy of about 220 PeV…
An extraordinary event consistent with a neutrino with an estimated energy of about 220 PeV (220 million billion electron volts), was detected on February 13, 2023 by the ARCA detector of the kilometre cubic neutrino telescope (KM3NeT) in the deep sea. This event, named KM3-230213A, is the most energetic neutrino ever observed and provides the first evidence that neutrinos of such high energies are produced in the Universe. After long and meticulous work to analyse and interpret the experimental data, today,
February 12, 2025, the international scientific collaboration of KM3NeT* reports the details of this amazing discovery in an article published in Nature.
The detected event was identified as a single muon which crossed the entire detector, inducing signals in more than one third of the active sensors. The inclination of its trajectory combined with its enormous energy provides compelling evidence that the muon originated from a cosmic neutrino interacting in the vicinity of the detector.
“KM3NeT has begun to probe a range of energy and sensitivity where detected neutrinos
may originate from extreme astrophysical phenomena. This first ever detection of a
neutrino of hundreds of PeV opens a new chapter in neutrino astronomy and a new
observational window on the Universe.”, comments Paschal Coyle, KM3NeT
Spokesperson at the time of the detection, and researcher at IN2P3/CNRS Centre
National de la Recherche Scientifique – Centre de Physique des Particules de Marseille,
France.
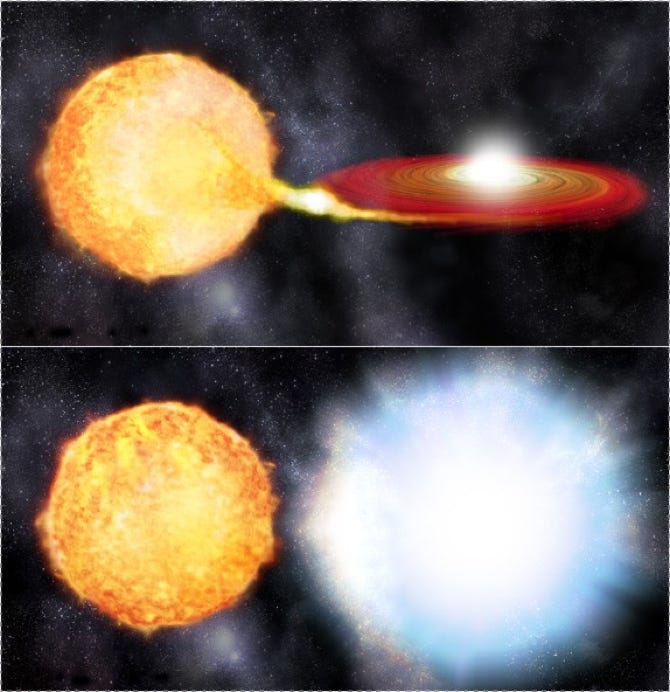
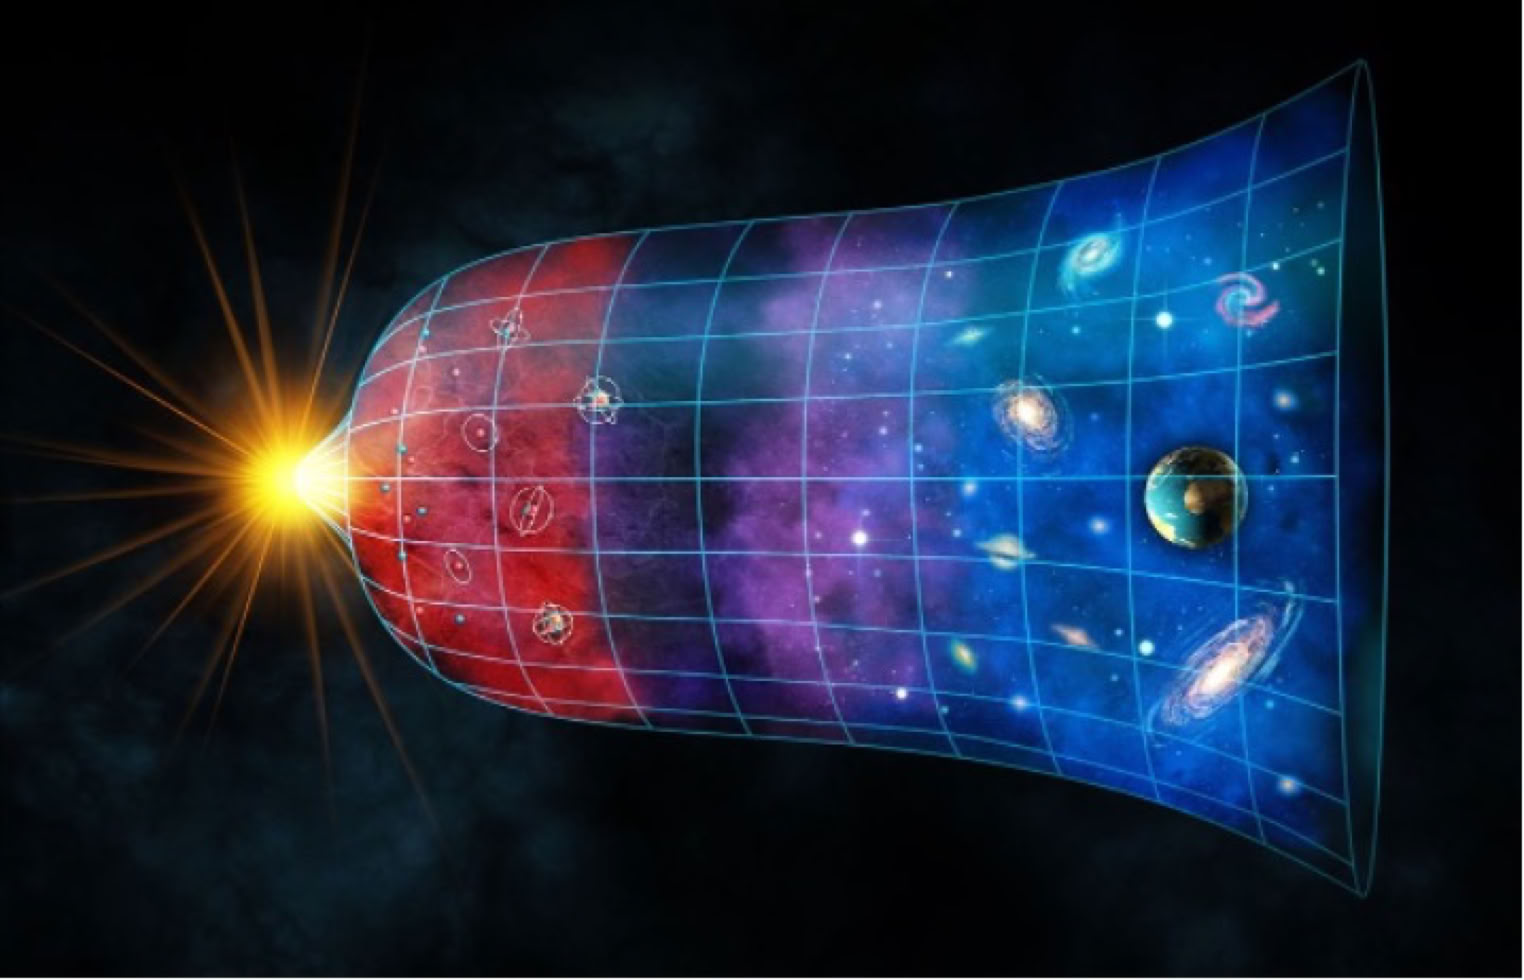
The high-energy universe is the realm of cataclysmic events such as accreting supermassive black holes at the centre of some galaxies, supernova explosions, gamma ray bursts, all as yet not fully understood. These powerful cosmic accelerators, generate streams of particles called cosmic rays. Some cosmic rays may interact with matter or photons around the source, to produce neutrinos and photons. During the travel of the most energetic cosmic rays across the Universe, some may also interact with photons of the cosmic microwave background radiation, to produce extremely energetic so-called “cosmogenic” neutrinos.
“Neutrinos are one of the most mysterious of elementary particles. They have no electric
charge, almost no mass and interact only weakly with matter. They are special cosmic
messengers, bringing us unique information on the mechanisms involved in the most
energetic phenomena and allowing us to explore the farthest reaches of the Universe.”,
explains Rosa Coniglione, KM3NeT Deputy-Spokesperson at the time of the detection,
researcher at the INFN National Institute for Nuclear Physics, Italy.
Although neutrinos are the second most abundant particle in the Universe after photons (light), their extremely weak interaction with matter makes them very hard to detect and requires enormous detectors. The KM3NeT neutrino telescope, currently under construction, is a giant deep sea infrastructure distributed across two detectors ARCA and ORCA. In its final configuration KM3NeT will occupy a volume of more than one cubic kilometre. KM3NeT uses sea water as the interaction medium for neutrinos. Its high-tech optical modules, detect the Cherenkov light, a bluish glow that is generated during the propagation through the water of the ultra-relativistic particles produced in neutrino interactions.
“To determine the direction and energy of this neutrino required a precise calibration of
the telescope and sophisticated track reconstruction algorithms. Furthermore, this
remarkable detection was achieved with only one tenth of the final configuration of the
detector, demonstrating the great potential of our experiment for the study of neutrinos
and for neutrino astronomy”, comments Aart Heijboer, KM3NeT Physics and Software
Manager at the time of the detection, and researcher at Nikhef National Institute for
Subatomic Physics, The Netherlands.
The KM3NeT/ARCA (Astroparticle Research with Cosmics in the Abyss) detector is mainly dedicated to the study of the highest energy neutrinos and their sources in the Universe. It is located at 3450 m depth, about 80 km from the coast of Portopalo di Capo Passero, Sicily. Its 700 m high detection units (DUs) are anchored to the seabed and positioned about 100 m apart. Every DU is equipped with 18 Digital Optical Modules (DOM) each containing 31 photomultipliers. In its final configuration, ARCA will comprise 230 DUs. The data collected are transmitted via a submarine cable to the shore station at the INFN Laboratori Nazionali del Sud.
The KM3NeT/ORCA (Oscillation Research with Cosmics in the Abyss) detector is optimised to study the fundamental properties of the neutrino itself. It is located at a depth of 2450 m, about 40 km from the coast of Toulon, France. It will comprise 115 DUs, each 200 m high and spaced by 20 m. The data collected by ORCA are sent to the shore station at La Seyne Sur Mer.
"The scale of KM3NeT, eventually encompassing a volume of about one cubic kilometre
with a total of about 200 000 PMTs, along with its extreme location in the abyss of the
Mediterranean Sea, demonstrates the extraordinary efforts required to advance neutrino
astronomy and particle physics. The detection of this event is the result of a tremendous
collaborative effort between many international teams of engineers, technicians and
scientists.", comments Miles Lindsey Clark, KM3NeT Technical Project Manager at the
time of the detection, and research engineer at the IN2P3/CNRS - Astroparticle and
Cosmology laboratory, France.
This ultra-high energy neutrino may originate directly from a powerful cosmic accelerator. Alternatively, it could be the first detection of a cosmogenic neutrino. However, based on this single neutrino it is difficult to conclude on its origin. Future observations will focus on detecting more such events to build a clearer picture. The ongoing expansion of KM3NeT with additional detection units and the acquisition of additional data will improve its sensitivity and enhance its ability to pinpoint cosmic neutrino sources, making it a leading contributor to multi-messenger astronomy.
This article was taken from the official press release.